
开发手册

# 前言
# 产品简介
金蝶Apusic监控平台软件(Apusic Monitor Platform ,以下简称AMP)是金蝶天燕云计算股份有限公司经过多年经验积累,维护实践、自主研发和技术创新的一体化云原生监控平台产品。
AMP从业务系统视角出发,对服务器、网络设备、存储、数据库、中间件、基础云服务、业务应用系统进行一体化、自动化、智能化的全面的监控和运维。保障IT基础设施的高可用和业务系统正常稳定可靠运行,极大提高信息中心IT运维的效率,使得对IT基础架构管理从被动分散的维护转变为主动集中的控制和自动化,智能化的管理。
# 范围和读者
本手册介绍AMPV3.0产品的使用详细说明,适用于AMP产品的用户,AMP产品技术顾问,AMP产品维护人员,以及希望学习了解AMP产品的相关人员。
# 自定义Exporter开发
本章通过简单教程指导用Java程序开发一个Exporter。
# 什么是Exporter
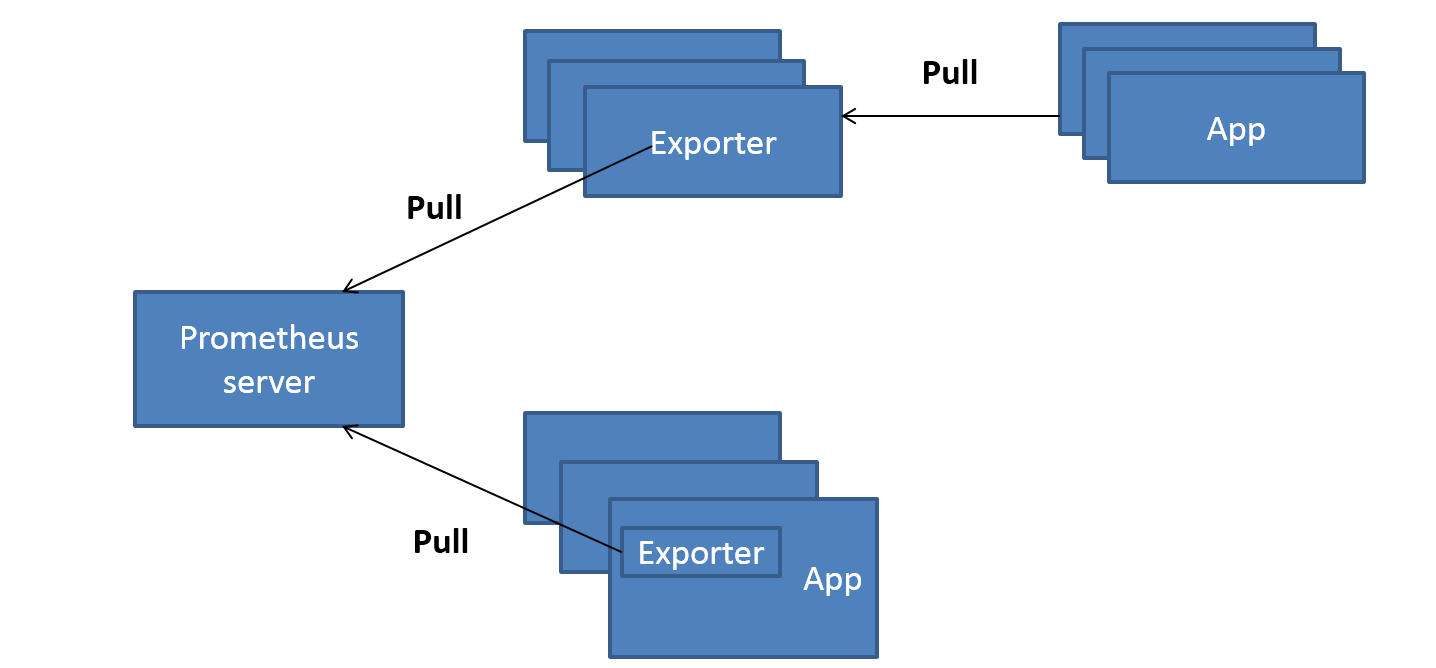
广义上讲所有可以向Prometheus提供监控样本数据的程序都可以被称为一个Exporter。而Exporter的一个实例称为target,如下所示,Prometheus通过轮询的方式定期从这些target中获取样本数据

# Exporter的来源
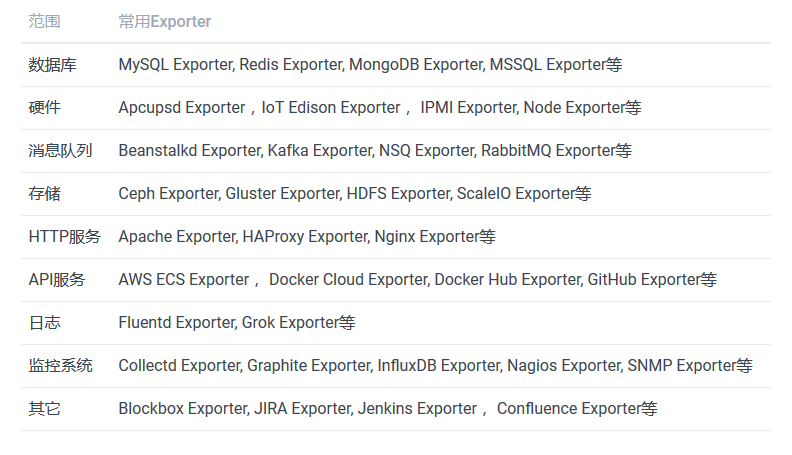
从Exporter的来源上来讲,主要分为两类: 社区提供的:
 用户自定义:
除了直接使用社区提供的Exporter程序以外,用户还可以基于Prometheus提供的Client Library创建自己的Exporter程序,目前Promthues社区官方提供了对以下编程语言的支持:Go、Java/Scala、Python、Ruby。同时还有第三方实现的如:Bash、C++、Common Lisp、Erlang,、Haskeel、Lua、Node.js、PHP、Rust等。
用户自定义:
除了直接使用社区提供的Exporter程序以外,用户还可以基于Prometheus提供的Client Library创建自己的Exporter程序,目前Promthues社区官方提供了对以下编程语言的支持:Go、Java/Scala、Python、Ruby。同时还有第三方实现的如:Bash、C++、Common Lisp、Erlang,、Haskeel、Lua、Node.js、PHP、Rust等。
# Exporter运行方式
从Exporter的运行方式上来讲,又可以分为:
独立使用的 以我们已经使用过的Node Exporter为例,由于操作系统本身并不直接支持Prometheus,同时用户也无法通过直接从操作系统层面上提供对Prometheus的支持。因此,用户只能通过独立运行一个程序的方式,通过操作系统提供的相关接口,将系统的运行状态数据转换为可供Prometheus读取的监控数据。 除了Node Exporter以外,比如MySQL Exporter、Redis Exporter等都是通过这种方式实现的。 这些Exporter程序扮演了一个中间代理人的角色。
集成到应用已有的 为了能够更好的监控系统的内部运行状态,有些开源项目如Kubernetes,ETCD等直接在代码中使用了Prometheus的Client Library,提供了对Prometheus的直接支持。这种方式打破的监控的界限,让应用程序可以直接将内部的运行状态暴露给Prometheus,适合于一些需要更多自定义监控指标需求的项目。
# Exporter规范
所有的Exporter程序都需要按照Prometheus的规范,返回监控的样本数据。以Node Exporter为例,当访问/metrics地址时会返回以下内容:
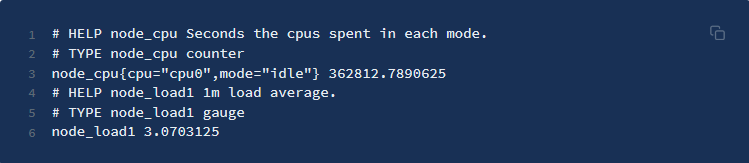 Exporter返回的样本数据,主要由三个部分组成:样本的一般注释信息(HELP),样本的类型注释信息(TYPE)和样本。Prometheus会对Exporter响应的内容逐行解析:
如果当前行以# HELP开始,Prometheus将会按照以下规则对内容进行解析,得到当前的指标名称以及相应的说明信息:
Exporter返回的样本数据,主要由三个部分组成:样本的一般注释信息(HELP),样本的类型注释信息(TYPE)和样本。Prometheus会对Exporter响应的内容逐行解析:
如果当前行以# HELP开始,Prometheus将会按照以下规则对内容进行解析,得到当前的指标名称以及相应的说明信息:
# HELP <metrics_name> <doc_string>
如果当前行以# TYPE开始,Prometheus会按照以下规则对内容进行解析,得到当前的指标名称以及指标类型:
# TYPE <metrics_name> <metrics_type>
TYPE注释行必须出现在指标的第一个样本之前。如果没有明确的指标类型需要返回为untyped。 除了# 开头的所有行都会被视为是监控样本数据。 每一行样本需要满足以下格式规范:
metric_name [
  "{" label_name "=" `"` label_value `"` { "," label_name "=" `"` label_value `"` } [ "," ] "}"
] value [ timestamp ]
2
3
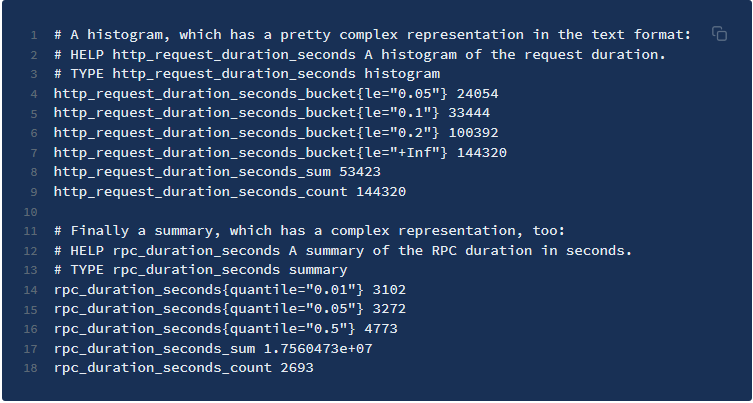
其中metric_name和label_name必须遵循PromQL的格式规范要求。value是一个float格式的数据,timestamp的类型为int64(从1970-01-01 00:00:00以来的毫秒数),timestamp为可选默认为当前时间。具有相同metric_name的样本必须按照一个组的形式排列,并且每一行必须是唯一的指标名称和标签键值对组合。 需要特别注意的是对于histogram和summary类型的样本。需要按照以下约定返回样本数据:
- 类型为summary或者histogram的指标x,该指标所有样本的值的总和需要使用一个单独的x_sum指标表示。
- 类型为summary或者histogram的指标x,该指标所有样本的总数需要使用一个单独的x_count指标表示。
- 对于类型为summary的指标x,其不同分位数quantile所代表的样本,需要使用单独的x{quantile="y"}表示。
- 对于类型histogram的指标x为了表示其样本的分布情况,每一个分布需要使用x_bucket{le="y"}表示,其中y为当前分布的上位数。同时必须包含一个样本x_bucket{le="+Inf"},并且其样本值必须和x_count相同。
- 对于histogram和summary的样本,必须按照分位数quantile和分布le的值的递增顺序排序。 以下是类型为histogram和summary的样本输出示例:
# 指标类型
为了能够帮助用户理解和区分这些不同监控指标之间的差异,Prometheus定义了4种不同的指标类型(metric type):Counter(计数器)、Gauge(仪表盘)、Histogram(直方图)、Summary(摘要)。 在Exporter返回的样本数据中,其注释中也包含了该样本的类型。例如:

# Counter
Counter类型的指标其工作方式和计数器一样,只增不减(除非系统发生重置)。常见的监控指标,如http_requests_total,node_cpu都是Counter类型的监控指标。 一般在定义Counter类型指标的名称时推荐使用_total作为后缀。 Counter是一个简单但有强大的工具,例如我们可以在应用程序中记录某些事件发生的次数,通过以时序的形式存储这些数据,我们可以轻松的了解该事件产生速率的变化。 PromQL内置的聚合操作和函数可以让用户对这些数据进行进一步的分析: 例如,通过rate()函数获取HTTP请求量的增长率: rate(http_requests_total[5m]) 查询当前系统中,访问量前10的HTTP地址: topk(10, http_requests_total)
# Gauge
与Counter不同,Gauge类型的指标侧重于反应系统的当前状态。因此这类指标的样本数据可增可减。常见指标如:node_memory_MemFree(主机当前空闲的内容大小)、node_memory_MemAvailable(可用内存大小)都是Gauge类型的监控指标。 通过Gauge指标,用户可以直接查看系统的当前状态: node_memory_MemFree 对于Gauge类型的监控指标,通过PromQL内置函数delta()可以获取样本在一段时间返回内的变化情况。例如,计算CPU温度在两个小时内的差异: delta(cpu_temp_celsius{host="zeus"}[2h]) 还可以使用deriv()计算样本的线性回归模型,甚至是直接使用predict_linear()对数据的变化趋势进行预测。例如,预测系统磁盘空间在4个小时之后的剩余情况: predict_linear(node_filesystem_free{job="node"}[1h], 4 * 3600)
# Histogram
在大多数情况下人们都倾向于使用某些量化指标的平均值,例如 CPU 的平均使用率、页面的平均响应时间。这种方式的问题很明显,以系统 API 调用的平均响应时间为例:如果大多数 API 请求都维持在 100ms 的响应时间范围内,而个别请求的响应时间需要 5s,那么就会导致某些 WEB 页面的响应时间落到中位数的情况,而这种现象被称为长尾问题。
为了区分是平均的慢还是长尾的慢,最简单的方式就是按照请求延迟的范围进行分组。例如,统计延迟在 0~10ms 之间的请求数有多少而 10~20ms 之间的请求数又有多少。通过这种方式可以快速分析系统慢的原因。Histogram 和 Summary 都是为了能够解决这样问题的存在,通过 Histogram 和 Summary 类型的监控指标,我们可以快速了解监控样本的分布情况。
Histogram 在一段时间范围内对数据进行采样(通常是请求持续时间或响应大小等),并将其计入可配置的存储桶(bucket)中,后续可通过指定区间筛选样本,也可以统计样本总数,最后一般将数据展示为直方图。
Histogram 类型的样本会提供三种指标(假设指标名称为
1.// 在总共2次请求当中。http 请求响应时间 <=0.005 秒 的请求次数为0
2.io_namespace_http_requests_latency_seconds_histogram_bucket{path="/",method="GET",code="200",le="0.005",} 0.0
3.// 在总共2次请求当中。http 请求响应时间 <=0.01 秒 的请求次数为0
4.io_namespace_http_requests_latency_seconds_histogram_bucket{path="/",method="GET",code="200",le="0.01",} 0.0
5.// 在总共2次请求当中。http 请求响应时间 <=0.025 秒 的请求次数为0
6.io_namespace_http_requests_latency_seconds_histogram_bucket{path="/",method="GET",code="200",le="0.025",} 0.0
7.io_namespace_http_requests_latency_seconds_histogram_bucket{path="/",method="GET",code="200",le="0.05",} 0.0
8.io_namespace_http_requests_latency_seconds_histogram_bucket{path="/",method="GET",code="200",le="0.075",} 0.0
9.io_namespace_http_requests_latency_seconds_histogram_bucket{path="/",method="GET",code="200",le="0.1",} 0.0
10.io_namespace_http_requests_latency_seconds_histogram_bucket{path="/",method="GET",code="200",le="0.25",} 0.0
11.io_namespace_http_requests_latency_seconds_histogram_bucket{path="/",method="GET",code="200",le="0.5",} 0.0
12.io_namespace_http_requests_latency_seconds_histogram_bucket{path="/",method="GET",code="200",le="0.75",} 0.0
13.io_namespace_http_requests_latency_seconds_histogram_bucket{path="/",method="GET",code="200",le="1.0",} 0.0
14.io_namespace_http_requests_latency_seconds_histogram_bucket{path="/",method="GET",code="200",le="2.5",} 0.0
15.io_namespace_http_requests_latency_seconds_histogram_bucket{path="/",method="GET",code="200",le="5.0",} 0.0
16.io_namespace_http_requests_latency_seconds_histogram_bucket{path="/",method="GET",code="200",le="7.5",} 2.0
17.// 在总共2次请求当中。http 请求响应时间 <=10 秒 的请求次数为 2
18.io_namespace_http_requests_latency_seconds_histogram_bucket{path="/",method="GET",code="200",le="10.0",} 2.0
19.io_namespace_http_requests_latency_seconds_histogram_bucket{path="/",method="GET",code="200",le="+Inf",} 2.0
所有样本值的大小总和,命名为 <basename>_sum
1.// 实际含义: 发生的2次 http 请求总的响应时间为 13.107670803000001 秒
2.io_namespace_http_requests_latency_seconds_histogram_sum{path="/",method="GET",code="200",} 13.107670803000001
样本总数,命名为 <basename>_count。值和 <basename>_bucket{le="+Inf"} 相同。
1.// 实际含义: 当前一共发生了 2 次 http 请求
2.io_namespace_http_requests_latency_seconds_histogram_count{path="/",method="GET",code="200",} 2.0
可以通过 histogram_quantile() 函数来计算 Histogram 类型样本的分位数。分位数可能不太好理解,你可以理解为分割数据的点。我举个例子,假设样本的 9 分位数(quantile=0.9)的值为 x,即表示小于 x 的采样值的数量占总体采样值的 90%。Histogram 还可以用来计算应用性能指标值(Apdex score)。
Summary
与 Histogram 类型类似,用于表示一段时间内的数据采样结果(通常是请求持续时间或响应大小等),但它直接存储了分位数(通过客户端计算,然后展示出来),而不是通过区间来计算。
Summary 类型的样本也会提供三种指标(假设指标名称为 ):
样本值的分位数分布情况,命名为 <basename>{quantile="<φ>"}。
1.// 含义:这 12 次 http 请求中有 50% 的请求响应时间是 3.052404983s
2.io_namespace_http_requests_latency_seconds_summary{path="/",method="GET",code="200",quantile="0.5",} 3.052404983
3.// 含义:这 12 次 http 请求中有 90% 的请求响应时间是 8.003261666s
4.io_namespace_http_requests_latency_seconds_summary{path="/",method="GET",code="200",quantile="0.9",} 8.003261666
所有样本值的大小总和,命名为 <basename>_sum。
1.// 含义:这12次 http 请求的总响应时间为 51.029495508s
2.io_namespace_http_requests_latency_seconds_summary_sum{path="/",method="GET",code="200",} 51.029495508
样本总数,命名为 <basename>_count。
// 含义:当前一共发生了 12 次 http 请求
io_namespace_http_requests_latency_seconds_summary_count{path="/",method="GET",code="200",} 12.0
2
3
4
5
6
7
8
9
10
11
12
13
14
15
16
17
18
19
20
21
22
23
24
25
26
27
28
29
30
31
32
33
34
35
36
37
38
39
40
可以通过 histogram_quantile() 函数来计算 Histogram 类型样本的分位数。分位数可能不太好理解,你可以理解为分割数据的点。我举个例子,假设样本的 9 分位数(quantile=0.9)的值为 x,即表示小于 x 的采样值的数量占总体采样值的 90%。Histogram 还可以用来计算应用性能指标值(Apdex score)。
# Summary
与 Histogram 类型类似,用于表示一段时间内的数据采样结果(通常是请求持续时间或响应大小等),但它直接存储了分位数(通过客户端计算,然后展示出来),而不是通过区间来计算。
Summary 类型的样本也会提供三种指标(假设指标名称为 ):
样本值的分位数分布情况,命名为
1.// 含义:这 12 次 http 请求中有 50% 的请求响应时间是 3.052404983s
2.io_namespace_http_requests_latency_seconds_summary{path="/",method="GET",code="200",quantile="0.5",} 3.052404983
3.// 含义:这 12 次 http 请求中有 90% 的请求响应时间是 8.003261666s
4.io_namespace_http_requests_latency_seconds_summary{path="/",method="GET",code="200",quantile="0.9",} 8.003261666
所有样本值的大小总和,命名为 <basename>_sum。
1.// 含义:这12次 http 请求的总响应时间为 51.029495508s
2.io_namespace_http_requests_latency_seconds_summary_sum{path="/",method="GET",code="200",} 51.029495508
样本总数,命名为 <basename>_count。
// 含义:当前一共发生了 12 次 http 请求
io_namespace_http_requests_latency_seconds_summary_count{path="/",method="GET",code="200",} 12.0
2
3
4
5
6
7
8
9
10
# 使用Java开发Exporter
前面我们已经讲过,Exporter的运行方式有两种,接下来会从两种运行方式来介绍如何用Java进行Exporter开发
# 独立的Exporter
client_java是Prometheus针对JVM类开发语言的client library库。 直接基于client_java,用户可以快速实现独立运行的Exporter程序,也可以在我们的项目源码中集成client_java以支持Prometheus。
# 添加Maven依赖
 1.<!-- simpleclient_httpserver模块实现了一个简单的HTTP服务器

2.             当向该服务器发送获取样本数据的请求时,
3.             他会调用所有Collector的collect()放方法,并且把所有样本数据转换为Prometheus要求的数据输出格式规范
4.             -->
5.             <dependency>
6.             <groupId>io.prometheus</groupId>
7.             <artifactId>simpleclient_httpserver</artifactId>
8.             <version>0.6.0</version>
9.             </dependency>
10.
11.             <!--
12.             client_java提供了多个内置的Collector模块
13.             以simpleclient_hotspot为例, 该模块中内置了对JVM虚拟的运行状态的Collector实现
14.             GC,内存池,JMX,类加载,线程池等
15.             -->
16.             <dependency>
17.             <groupId>io.prometheus</groupId>
18.             <artifactId>simpleclient_hotspot</artifactId>
19.             <version>0.6.0</version>
20.             </dependency>
2
3
4
5
6
7
8
9
10
11
12
13
14
15
16
17
18
19
20
21
# 自定义Collector
在client_java的simpleclient模块中提供了自定义监控指标的核心接口。 当无法直接修改监控目标时,可以通过自定义Collector的方式,实现对监控样本收集,该收集器需要实现collect()方法并返回一组监控样本,如下所示:
1.public class YourCustomCollector extends Collector {
2.    public List<MetricFamilySamples> collect() {
3.        List<MetricFamilySamples> mfs = new ArrayList<MetricFamilySamples>();
4.
5.        String metricName = "my_guage_1";
6.
7.        // Your code to get metrics
8.
9.        MetricFamilySamples.Sample sample = new MetricFamilySamples.Sample(metricName, Arrays.asList("l1"), Arrays.asList("v1"), 4);
10.        MetricFamilySamples.Sample sample2 = new MetricFamilySamples.Sample(metricName, Arrays.asList("l1", "l2"), Arrays.asList("v1", "v2"), 3);
11.
12.        MetricFamilySamples samples = new MetricFamilySamples(metricName, Type.GAUGE, "help", Arrays.asList(sample, sample2));
13.
14.        mfs.add(samples);
15.        return mfs;
16.    }
17.}
2
3
4
5
6
7
8
9
10
11
12
13
14
15
16
17
这里定义了一个名为my_guage的监控指标,该监控指标的所有样本数据均转换为一个MetricFamilySamples.Sample实例,该实例中包含了该样本的指标名称、标签名数组、标签值数组以及样本数据的值。
监控指标my_guage的所有样本值,需要持久化到一个MetricFamilySamples实例中,MetricFamilySamples指定了当前监控指标的名称、类型、注释信息等。需要注意的是MetricFamilySamples中所有样本的名称必须保持一致,否则生成的数据将无法符合Prometheus的规范。
直接使用MetricFamilySamples.Sample和MetricFamilySamples的方式适用于当某监控指标的样本之间的标签可能不一致的情况,例如,当监控容器时,不同容器实例可能包含一些自定义的标签,如果需要将这些标签反应到样本上,那么每个样本的标签则不可能保持一致。而如果所有样本的是一致的情况下,我们还可以使用client_java针对不同指标类型的实现GaugeMetricFamily,CounterMetricFamily,SummaryMetricFamily等,例如:
1.class YourCustomCollector2 extends Collector {
2.  List<MetricFamilySamples> collect() {
3.    List<MetricFamilySamples> mfs = new ArrayList<MetricFamilySamples>();
4.
5.    // With no labels.
6.    mfs.add(new GaugeMetricFamily("my_gauge_2", "help", 42));
7.
8.    // With labels
9.    GaugeMetricFamily labeledGauge = new GaugeMetricFamily("my_other_gauge", "help", Arrays.asList("labelname"));
10.    labeledGauge.addMetric(Arrays.asList("foo"), 4);
11.    labeledGauge.addMetric(Arrays.asList("bar"), 5);
12.    mfs.add(labeledGauge);
13.
14.    return mfs;
15.  }
}
2
3
4
5
6
7
8
9
10
11
12
13
14
15
16
使用HTTP Server暴露样本数据 client_java下的simpleclient_httpserver模块实现了一个简单的HTTP服务器,当向该服务器发送获取样本数据的请求后,它会自动调用所有Collector的collect()方法,并将所有样本数据转换为Prometheus要求的数据输出格式规范。 添加依赖之后,就可以在Exporter程序的main方法中启动一个HTTPServer实例:
1.public class CustomExporter {
2.    public static void main(String[] args) throws IOException {
3.        HTTPServer server = new HTTPServer(1234);
4.    }
5.}
2
3
4
5
而在启动之前,别忘记调用Collector的register()方法。否则HTTPServer是找不到任何的Collector实例的:
1.new YourCustomCollector().register();
2.new YourCustomCollector2().register();
2
运行CustomExporter并访问http://127.0.0.1:1234/metrics,即可获取到以下数据:
1.$ curl http://127.0.0.1:1234/metrics
2.# HELP my_gauge help
3.# TYPE my_gauge gauge
4.my_gauge 42.0
5.# HELP my_other_gauge help
6.# TYPE my_other_gauge gauge
7.my_other_gauge{labelname="foo",} 4.0
8.my_other_gauge{labelname="bar",} 5.0
9.# HELP my_guage help
10.# TYPE my_guage gauge
11.my_guage{l1="v1",} 4.0
12.my_guage{l1="v1",l2="v2",} 3.0
2
3
4
5
6
7
8
9
10
11
12
当然HTTPServer中并不存在什么黑魔法,其内部实现如下所示:
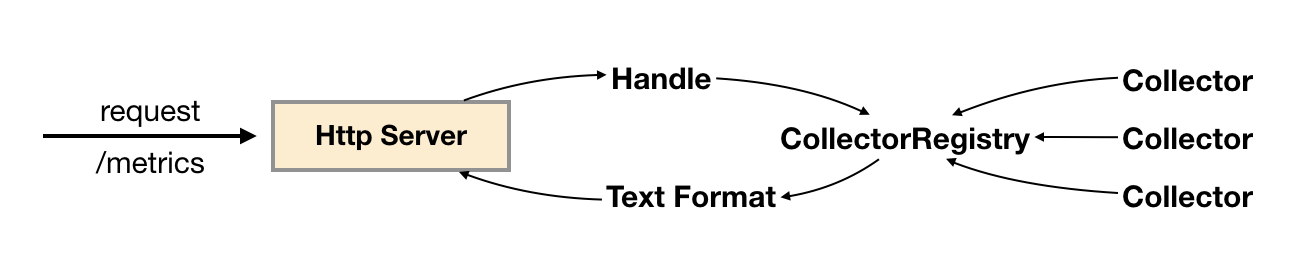 当调用Collector实例register()方法时,会将该实例保存到CollectorRegistry当中,CollectorRegistry负责维护当前系统中所有的Collector实例。 HTTPServer在接收到HTTP请求之后,会从CollectorRegistry中拿到所有的Collector实例,并调用其collect()方法获取所有样本,最后格式化为Prometheus的标准输出。
除了直接使用HTTPServer以外暴露样本数据以外,client_java中还提供了对Spring Boot、Spring Web以及Servlet的支持。
当调用Collector实例register()方法时,会将该实例保存到CollectorRegistry当中,CollectorRegistry负责维护当前系统中所有的Collector实例。 HTTPServer在接收到HTTP请求之后,会从CollectorRegistry中拿到所有的Collector实例,并调用其collect()方法获取所有样本,最后格式化为Prometheus的标准输出。
除了直接使用HTTPServer以外暴露样本数据以外,client_java中还提供了对Spring Boot、Spring Web以及Servlet的支持。
# 使用内置的Collector
通过client_java中定义的标准接口,用户可以快速实现自己的监控数据收集器,并通过HTTPServer将样本数据输出给Prometheus。除了提供接口规范以外,client_java还提供了多个内置的Collector模块,以simpleclient_hotspot为例,该模块中内置了对JVM虚拟机运行状态(GC,内存池,JMX,类加载,线程池等)数据的Collector实现,用户可以通过在Maven中添加以下依赖,导入simpleclient_hotspot:
1.<dependency>

2.            <groupId>io.prometheus</groupId>
3.            <artifactId>simpleclient_hotspot</artifactId>
4.            <version>0.6.0</version>
5.            </dependency>
2
3
4
5
6
通过调用io.prometheus.client.hotspot.DefaultExport的initialize方法注册该模块中所有的Collector实例:
DefaultExports.initialize();
重新运行CustomExporter,并获取样本数据:
1.$ curl http://127.0.0.1:1234/metrics
2.# HELP jvm_buffer_pool_used_bytes Used bytes of a given JVM buffer pool.
3.# TYPE jvm_buffer_pool_used_bytes gauge
4.jvm_buffer_pool_used_bytes{pool="direct",} 8192.0
5.jvm_buffer_pool_used_bytes{pool="mapped",} 0.0
2
3
4
5
6
除了之前自定义的监控指标以外,在响应内容中还会得到当前JVM的运行状态数据。在client_java项目中除了使用内置了对JVM监控的Collector以外,还实现了对Hibernate,Guava Cache,Jetty,Log4j、Logback等监控数据收集的支持。用户只需要添加相应的依赖,就可以直接进行使用。
# 在业务代码中进行监控埋点
在client_java中除了使用Collector直接采集样本数据以外,还直接提供了对Prometheus中4种监控类型的实现分别是:Counter、Gauge、Summary和Histogram。 基于这些实现,开发人员可以非常方便的在应用程序的业务流程中进行监控埋点。 简单类型Gauge和Counter 以Gauge为例,当我们需要监控某个业务当前正在处理的请求数量,可以使用以下方式实现:
1.public class YourClass {

2.
3.            static final Gauge inprogressRequests = Gauge.build()
4.            .name("inprogress_requests").help("Inprogress requests.").register();
5.
6.            void processRequest() {
7.            inprogressRequests.inc();
8.            // Your code here.
9.            inprogressRequests.dec();
10.            }
11.            12.}
2
3
4
5
6
7
8
9
10
11
12
Gauge继承自Collector,registoer()方法会将该Gauge实例注册到CollectorRegistry中。这里创建了一个名为inprogress_requests的监控指标,其注释信息为"Inprogress requests"。 Gauge对象主要包含两个方法inc()和dec(),分别用于计数器+1和-1。 如果监控指标中还需要定义标签,则可以使用Gauge构造器的labelNames()方法,声明监控指标的标签,同时在样本计数时,通过指标的labels()方法指定标签的值,如下所示:
1.public class YourClass {
2.
3.    static final Gauge inprogressRequests = Gauge.build()
4.            .name("inprogress_requests")
5.            .labelNames("method")
6.            .help("Inprogress requests.").register();
7.
8.    void processRequest() {
9.        inprogressRequests.labels("get").inc();
10.        // Your code here.
11.        inprogressRequests.labels("get").dec();
12.    }
13.
14.}
2
3
4
5
6
7
8
9
10
11
12
13
14
Counter与Gauge的使用方法一致,唯一的区别在于Counter实例只包含一个inc()方法,用于计数器+1。
# 复杂类型Summary和Histogram
Summary和Histogram用于统计和分析样本的分布情况。如下所示,通过Summary可以将HTTP请求的字节数以及请求处理时间作为统计样本,直接统计其样本的分布情况。
1.class YourClass {
2.  static final Summary receivedBytes = Summary.build()
3.     .name("requests_size_bytes").help("Request size in bytes.").register();
4.  static final Summary requestLatency = Summary.build()
5.     .name("requests_latency_seconds").help("Request latency in seconds.").register();
6.
7.  void processRequest(Request req) {
8.    Summary.Timer requestTimer = requestLatency.startTimer();
9.    try {
10.      // Your code here.
11.    } finally {
12.      receivedBytes.observe(req.size());
13.      requestTimer.observeDuration();
14.    }
15.  }
}
2
3
4
5
6
7
8
9
10
11
12
13
14
15
16
除了使用Timer进行计时以外,Summary实例也提供了timer()方法,可以对线程或者Lamda表达式运行时间进行统计:
1.class YourClass {
2.  static final Summary requestLatency = Summary.build()
3.    .name("requests_latency_seconds").help("Request latency in seconds.").register();
4.
5.  void processRequest(Request req) {
6.    requestLatency.timer(new Runnable() {
7.      public abstract void run() {
8.        // Your code here.
9.      }
10.    });
11.
12.    // Or the Java 8 lambda equivalent
13.    requestLatency.timer(() -> {
14.      // Your code here.
15.    });
16.  }
}
2
3
4
5
6
7
8
9
10
11
12
13
14
15
16
17
Summary和Histogram的用法基本保持一致,区别在于Summary可以指定在客户端统计的分位数,如下所示:
1.static final Summary requestLatency = Summary.build()
2.    .quantile(0.5, 0.05)   // 其中0.05为误差
3.    .quantile(0.9, 0.01)   // 其中0.01为误差
4.    .name("requests_latency_seconds").help("Request latency in seconds.").register();
2
3
4
对于Histogram而言,默认的分布桶为[.005, .01, .025, .05, .075, .1, .25, .5, .75, 1, 2.5, 5, 7.5, 10],如果需要指定自定义的桶分布,可以使用buckets()方法指定,如下所示:
1.static final Histogram requestLatency = Histogram.build()
2.           .name("requests_latency_seconds").help("Request latency in seconds.")
3.           .buckets(0.1, 0.2, 0.4, 0.8)
4.           .register();
2
3
4
# 在应用中内置Prometheus支持
# 在应用中内置Prometheus支持
本小节以Spring Boot 1.5.2为例,介绍如何在应用代码中集成client_java。 添加Prometheus Java Client相关的依赖:
1.<properties>

2.        <java.version>1.8</java.version>
3.        <prometheus.simpleclient>0.6.0</prometheus.simpleclient>
          4.</properties>
          5.<dependency>
4.        <groupId>io.prometheus</groupId>
5.        <artifactId>simpleclient</artifactId>
6.        <version>${prometheus.simpleclient}</version>
7.        </dependency>
8.
9.        <dependency>
10.        <groupId>io.prometheus</groupId>
11.        <artifactId>simpleclient_spring_boot</artifactId>
12.        <version>${prometheus.simpleclient}</version>
13.        </dependency>
14.
15.        <dependency>
16.        <groupId>io.prometheus</groupId>
17.        <artifactId>simpleclient_hotspot</artifactId>
18.        <version>${prometheus.simpleclient}</version>
19.        </dependency>
2
3
4
5
6
7
8
9
10
11
12
13
14
15
16
17
18
19
20
21
22
通过注解@EnablePrometheusEndpoint启用Prometheus Endpoint,这里同时使用了simpleclient_hotspot中提供的DefaultExporter。该Exporter会在metrics endpoint中统计当前应用JVM的相关信息:
1.@SpringBootApplication
2.@EnablePrometheusEndpoint
3.public class SpringApplication implements CommandLineRunner {

2.
3.        public static void main(String[] args) {
4.        SpringApplication.run(GatewayApplication.class, args);
5.        }
6.
7.        @Override
8.        public void run(String... strings) throws Exception {
9.        DefaultExports.initialize();
10.        }
           13.}
           默认情况下Prometheus暴露的metrics endpoint为 /prometheus,可以通过endpoint配置进行修改:
           1.endpoints:
11.        prometheus:
12.        id: metrics
13.        metrics:
14.        id: springmetrics
15.        sensitive: false
16.        enabled: true
2
3
4
5
6
7
8
9
10
11
12
13
14
15
16
17
18
19
20
21
22
启动应用程序访问http://localhost:8080/metrics可以看到以下输出内容:
1.# HELP jvm_gc_collection_seconds Time spent in a given JVM garbage collector in seconds.
2.# TYPE jvm_gc_collection_seconds summary
3.jvm_gc_collection_seconds_count{gc="PS Scavenge",} 11.0
4.jvm_gc_collection_seconds_sum{gc="PS Scavenge",} 0.18
5.jvm_gc_collection_seconds_count{gc="PS MarkSweep",} 2.0
6.jvm_gc_collection_seconds_sum{gc="PS MarkSweep",} 0.121
7.# HELP jvm_classes_loaded The number of classes that are currently loaded in the JVM
8.# TYPE jvm_classes_loaded gauge
9.jvm_classes_loaded 8376.0
10.# HELP jvm_classes_loaded_total The total number of classes that have been loaded since the JVM has started execution
11.# TYPE jvm_classes_loaded_total counter
12....
2
3
4
5
6
7
8
9
10
11
12
# 添加拦截器,为监控埋点做准备
除了获取应用JVM相关的状态以外,我们还可能需要添加一些自定义的监控Metrics实现对系统性能,以及业务状态进行采集,以提供日后优化的相关支撑数据。首先我们使用拦截器处理对应用的所有请求。 继承WebMvcConfigurerAdapter类并复写addInterceptors方法,对所有请求/**添加拦截器
1.@SpringBootApplication
2.@EnablePrometheusEndpoint
3.public class SpringApplication extends WebMvcConfigurerAdapter implements CommandLineRunner {

2.        @Override
3.        public void addInterceptors(InterceptorRegistry registry) {
4.        registry.addInterceptor(new PrometheusMetricsInterceptor()).addPathPatterns("/**");
5.        }
          8.}
2
3
4
5
6
7
8
9
PrometheusMetricsInterceptor继承自HandlerInterceptorAdapter,通过复写父方法preHandle和afterCompletion可以拦截一个HTTP请求生命周期的不同阶段:
1.public class PrometheusMetricsInterceptor extends HandlerInterceptorAdapter {
2.    @Override
3.    public boolean preHandle(HttpServletRequest request, HttpServletResponse response, Object handler) throws Exception {
4.        return super.preHandle(request, response, handler);
5.    }
6.
7.    @Override
8.    public void afterCompletion(HttpServletRequest request, HttpServletResponse response, Object handler, Exception ex) throws Exception {
9.        super.afterCompletion(request, response, handler, ex);
10.    }
}
2
3
4
5
6
7
8
9
10
11
# 自定义监控指标
一旦PrometheusMetricsInterceptor能够成功拦截和处理请求之后,我们就可以使用client java自定义多种监控指标。 计数器可以用于记录只会增加不会减少的指标类型,比如记录应用请求的总量(http_requests_total),cpu使用时间(process_cpu_seconds_total)等。 一般而言,Counter类型的metrics指标在命名中我们使用_total结束。 使用Counter.build()创建Counter类型的监控指标,并且通过name()方法定义监控指标的名称,通过labelNames()定义该指标包含的标签。最后通过register()将该指标注册到Collector的defaultRegistry中中。
1.public class PrometheusMetricsInterceptor extends HandlerInterceptorAdapter {
2.
3.    static final Counter requestCounter = Counter.build()
4.            .name("io_namespace_http_requests_total").labelNames("path", "method", "code")
5.            .help("Total requests.").register();
6.
7.    @Override
8.    public void afterCompletion(HttpServletRequest request, HttpServletResponse response, Object handler, Exception ex) throws Exception {
9.        String requestURI = request.getRequestURI();
10.        String method = request.getMethod();
11.        int status = response.getStatus();
12.
13.        requestCounter.labels(requestURI, method, String.valueOf(status)).inc();
14.        super.afterCompletion(request, response, handler, ex);
15.    }
16.}
2
3
4
5
6
7
8
9
10
11
12
13
14
15
16
在afterCompletion方法中,可以获取到当前请求的请求路径、请求方法以及状态码。 这里通过labels指定了当前样本各个标签对应的值,最后通过.inc()计数器+1:
requestCounter.labels(requestURI, method, String.valueOf(status)).inc();
使用Gauge可以反映应用的当前状态,例如在监控主机时,主机当前空闲的内容大小(node_memory_MemFree),可用内存大小(node_memory_MemAvailable)。或者容器当前的CPU使用率,内存使用率。这里我们使用Gauge记录当前应用正在处理的Http请求数量。
1.public class PrometheusMetricsInterceptor extends HandlerInterceptorAdapter {
2.
3.    ...省略的代码
4.    static final Gauge inprogressRequests = Gauge.build()
5.            .name("io_namespace_http_inprogress_requests").labelNames("path", "method")
6.            .help("Inprogress requests.").register();
7.
8.    @Override
9.    public boolean preHandle(HttpServletRequest request, HttpServletResponse response, Object handler) throws Exception {
10.        ...省略的代码
11.        // 计数器+1
12.        inprogressRequests.labels(requestURI, method).inc();
13.        return super.preHandle(request, response, handler);
14.    }
15.
16.    @Override
17.    public void afterCompletion(HttpServletRequest request, HttpServletResponse response, Object handler, Exception ex) throws Exception {
18.        ...省略的代码
19.        // 计数器-1
20.        inprogressRequests.labels(requestURI, method).dec();
21.
22.        super.afterCompletion(request, response, handler, ex);
23.    }
}
2
3
4
5
6
7
8
9
10
11
12
13
14
15
16
17
18
19
20
21
22
23
24
Histogram主要用于在指定分布范围内(Buckets)记录大小(如http request bytes)或者事件发生的次数。以请求响应时间requests_latency_seconds为例。
1.public class PrometheusMetricsInterceptor extends HandlerInterceptorAdapter {
2.
3.    static final Histogram requestLatencyHistogram = Histogram.build().labelNames("path", "method", "code")
4.            .name("io_namespace_http_requests_latency_seconds_histogram").help("Request latency in seconds.")
5.            .register();
6.
7.    private Histogram.Timer histogramRequestTimer;
8.
9.    @Override
10.    public boolean preHandle(HttpServletRequest request, HttpServletResponse response, Object handler) throws Exception {
11.        ...省略的代码
12.        histogramRequestTimer = requestLatencyHistogram.labels(requestURI, method, String.valueOf(status)).startTimer();
13.        ...省略的代码
14.    }
15.
16.    @Override
17.    public void afterCompletion(HttpServletRequest request, HttpServletResponse response, Object handler, Exception ex) throws Exception {
18.        ...省略的代码
19.        histogramRequestTimer.observeDuration();
20.        ...省略的代码
21.    }
}
2
3
4
5
6
7
8
9
10
11
12
13
14
15
16
17
18
19
20
21
22
Histogram会自动创建3个指标,分别为: 事件发生总次数: basename_count
1.# 实际含义: 当前一共发生了2次http请求
io_namespace_http_requests_latency_seconds_histogram_count{path="/",method="GET",code="200",} 2.0
2
所有事件产生值的大小的总和: basename_sum
# 实际含义: 发生的2次http请求总的响应时间为13.107670803000001 秒
io_namespace_http_requests_latency_seconds_histogram_sum{path="/",method="GET",code="200",} 13.107670803000001
2
事件产生的值分布在bucket中的次数: basename_bucket{le="上包含"}
# 在总共2次请求当中。http请求响应时间 <=0.005 秒 的请求次数为0
io_namespace_http_requests_latency_seconds_histogram_bucket{path="/",method="GET",code="200",le="0.005",} 0.0
# 在总共2次请求当中。http请求响应时间 <=0.01 秒 的请求次数为0
io_namespace_http_requests_latency_seconds_histogram_bucket{path="/",method="GET",code="200",le="0.01",} 0.0
# 在总共2次请求当中。http请求响应时间 <=0.025 秒 的请求次数为0
io_namespace_http_requests_latency_seconds_histogram_bucket{path="/",method="GET",code="200",le="0.025",} 0.0
io_namespace_http_requests_latency_seconds_histogram_bucket{path="/",method="GET",code="200",le="0.05",} 0.0
io_namespace_http_requests_latency_seconds_histogram_bucket{path="/",method="GET",code="200",le="0.075",} 0.0
io_namespace_http_requests_latency_seconds_histogram_bucket{path="/",method="GET",code="200",le="0.1",} 0.0
io_namespace_http_requests_latency_seconds_histogram_bucket{path="/",method="GET",code="200",le="0.25",} 0.0
io_namespace_http_requests_latency_seconds_histogram_bucket{path="/",method="GET",code="200",le="0.5",} 0.0
io_namespace_http_requests_latency_seconds_histogram_bucket{path="/",method="GET",code="200",le="0.75",} 0.0
io_namespace_http_requests_latency_seconds_histogram_bucket{path="/",method="GET",code="200",le="1.0",} 0.0
io_namespace_http_requests_latency_seconds_histogram_bucket{path="/",method="GET",code="200",le="2.5",} 0.0
io_namespace_http_requests_latency_seconds_histogram_bucket{path="/",method="GET",code="200",le="5.0",} 0.0
io_namespace_http_requests_latency_seconds_histogram_bucket{path="/",method="GET",code="200",le="7.5",} 2.0
# 在总共2次请求当中。http请求响应时间 <=10 秒 的请求次数为0
io_namespace_http_requests_latency_seconds_histogram_bucket{path="/",method="GET",code="200",le="10.0",} 2.0
# 在总共2次请求当中。http请求响应时间 10 秒 的请求次数为0
io_namespace_http_requests_latency_seconds_histogram_bucket{path="/",method="GET",code="200",le="+Inf",} 2.0
2
3
4
5
6
7
8
9
10
11
12
13
14
15
16
17
18
19
20
Summary和Histogram非常类型相似,都可以统计事件发生的次数或者发小,以及其分布情况。Summary和Histogram都提供了对于事件的计数_count以及值的汇总_sum。 因此使用_count,和_sum时间序列可以计算出相同的内容,例如http每秒的平均响应时间:rate(basename_sum[5m]) / rate(basename_count[5m])。同时Summary和Histogram都可以计算和统计样本的分布情况,比如中位数,9分位数等等。其中 0.0<= 分位数Quantiles <= 1.0。
不同在于Histogram可以通过histogram_quantile函数在服务器端计算分位数,而Sumamry的分位数则是直接在客户端进行定义。因此对于分位数的计算。 Summary在通过PromQL进行查询时有更好的性能表现,而Histogram则会消耗更多的资源。相对的对于客户端而言Histogram消耗的资源更少。
1.public class PrometheusMetricsInterceptor extends HandlerInterceptorAdapter {
2.
3.    static final Summary requestLatency = Summary.build()
4.            .name("io_namespace_http_requests_latency_seconds_summary")
5.            .quantile(0.5, 0.05)
6.            .quantile(0.9, 0.01)
7.            .labelNames("path", "method", "code")
8.            .help("Request latency in seconds.").register();
9.
10.
11.    @Override
12.    public boolean preHandle(HttpServletRequest request, HttpServletResponse response, Object handler) throws Exception {
13.        ...省略的代码
14.        requestTimer = requestLatency.labels(requestURI, method, String.valueOf(status)).startTimer();
15.        ...省略的代码
16.    }
17.
18.    @Override
19.    public void afterCompletion(HttpServletRequest request, HttpServletResponse response, Object handler, Exception ex) throws Exception {
20.        ...省略的代码
21.        requestTimer.observeDuration();
22.        ...省略的代码
23.    }
}
2
3
4
5
6
7
8
9
10
11
12
13
14
15
16
17
18
19
20
21
22
23
24
使用Summary指标,会自动创建多个时间序列:
事件发生总的次数
# 含义:当前http请求发生总次数为12次
io_namespace_http_requests_latency_seconds_summary_count{path="/",method="GET",code="200",} 12.0
2
事件产生的值的总和
# 含义:这12次http请求的总响应时间为 51.029495508s
io_namespace_http_requests_latency_seconds_summary_sum{path="/",method="GET",code="200",} 51.029495508
2
事件产生的值的分布情况
# 含义:这12次http请求响应时间的中位数是3.052404983s
io_namespace_http_requests_latency_seconds_summary{path="/",method="GET",code="200",quantile="0.5",} 3.052404983
# 含义:这12次http请求响应时间的9分位数是8.003261666s
io_namespace_http_requests_latency_seconds_summary{path="/",method="GET",code="200",quantile="0.9",} 8.003261666
2
3
4
# 使用Collector暴露其它指标
除了在拦截器中使用Prometheus提供的Counter,Summary,Gauage等构造监控指标以外,我们还可以通过自定义的Collector实现对相关业务指标的暴露。例如,我们可以通过自定义Collector直接从应用程序的数据库中统计监控指标.
1.@SpringBootApplication
2.@EnablePrometheusEndpoint
3.public class SpringApplication extends WebMvcConfigurerAdapter implements CommandLineRunner {
4.
5.    @Autowired
6.    private CustomExporter customExporter;
7.
8.    ...省略的代码
9.
10.    @Override
11.    public void run(String... args) throws Exception {
12.        ...省略的代码
13.        customExporter.register();
14.    }
}
2
3
4
5
6
7
8
9
10
11
12
13
14
15
CustomExporter集成自io.prometheus.client.Collector,在调用Collector的register()方法后,当访问/metrics时,则会自动从Collector的collection()方法中获取采集到的监控指标。
由于这里CustomExporter存在于Spring的IOC容器当中,这里可以直接访问业务代码,返回需要的业务相关的指标。
1.import io.prometheus.client.Collector;
2.import io.prometheus.client.GaugeMetricFamily;
3.import org.springframework.stereotype.Component;
4.
5.import java.util.ArrayList;
6.import java.util.Collections;
7.import java.util.List;
8.
9.@Component
10.public class CustomExporter extends Collector {
11.    @Override
12.    public List<MetricFamilySamples> collect() {
13.        List<MetricFamilySamples> mfs = new ArrayList<>();
14.
15.        # 创建metrics指标
16.        GaugeMetricFamily labeledGauge =
17.                new GaugeMetricFamily("io_namespace_custom_metrics", "custom metrics", Collections.singletonList("labelname"));
18.
19.        # 设置指标的label以及value
20.        labeledGauge.addMetric(Collections.singletonList("labelvalue"), 1);
21.
22.        mfs.add(labeledGauge);
23.        return mfs;
24.    }
}
2
3
4
5
6
7
8
9
10
11
12
13
14
15
16
17
18
19
20
21
22
23
24
25
这里也可以使用CounterMetricFamily,SummaryMetricFamily声明其它的指标类型。